Class vote picture graphs: a nonpartisan Election Week math activity for special ed
Election Day was Tuesday, November 3, 2026, and students may be hearing words like vote, choice, and most this week. A class vote on something low-stakes, like a favorite fruit, turns that vocabulary into a math lesson without any politics. In SkillSprout you can type your class's four vote counts into the picture graph builder and print a graph of the results, with questions and an answer key. This post shows two real Grade 3 sheets made that way.
Step 1: Hold a quick class vote
Show four fruit pictures: apples, bananas, oranges, and grapes. Each student picks one, by pointing, saying it, using AAC, or placing a sticky note. Count the votes together. Those four numbers become the graph.
The builder needs four different counts, each from 1 to 5 at Level 1 or 1 to 8 at Level 2 (Level 3 goes to 10). If two fruits tie, or one gets no votes, the sheet cannot use those exact counts; you can add a staff vote or uncheck Set graph counts to print fresh graph data instead.
Step 2: Read the class graph
In this example the class voted 5 apples, 3 bananas, 4 oranges, and 2 grapes. Each picture is one student, and the key says so. The questions ask how many students chose grapes, apples, and bananas.
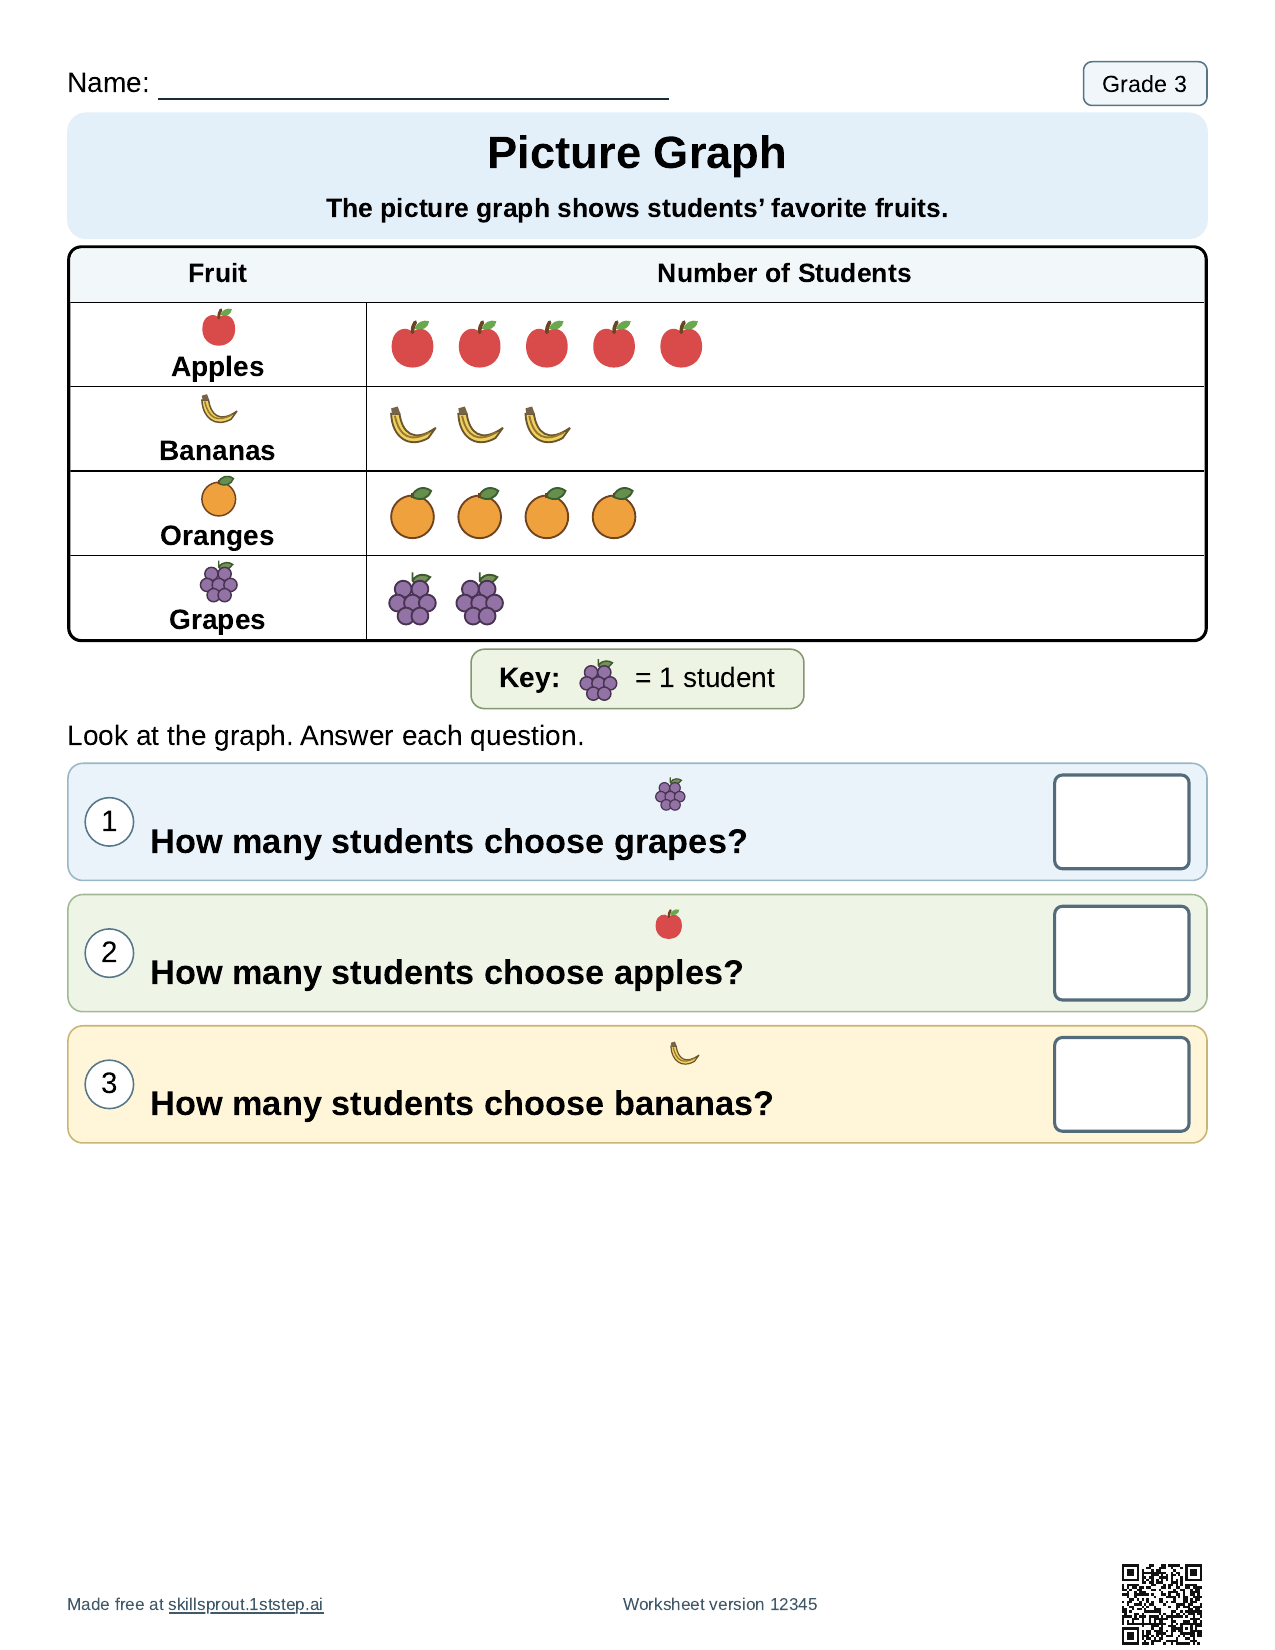
The answers are 2 grapes, 5 apples, and 3 bananas. The answer key prints after the student page and is calculated from the graph, so it matches what students see.
Step 3: Compare the results
Once students can read each row, compare. This sheet uses the Picture Graph · Compare type at Level 2 with the counts 7 apples, 4 bananas, 6 oranges, and 2 grapes. It asks which choice has the most students, which has more (apples or oranges, bananas or grapes), and which has fewer (oranges or grapes).
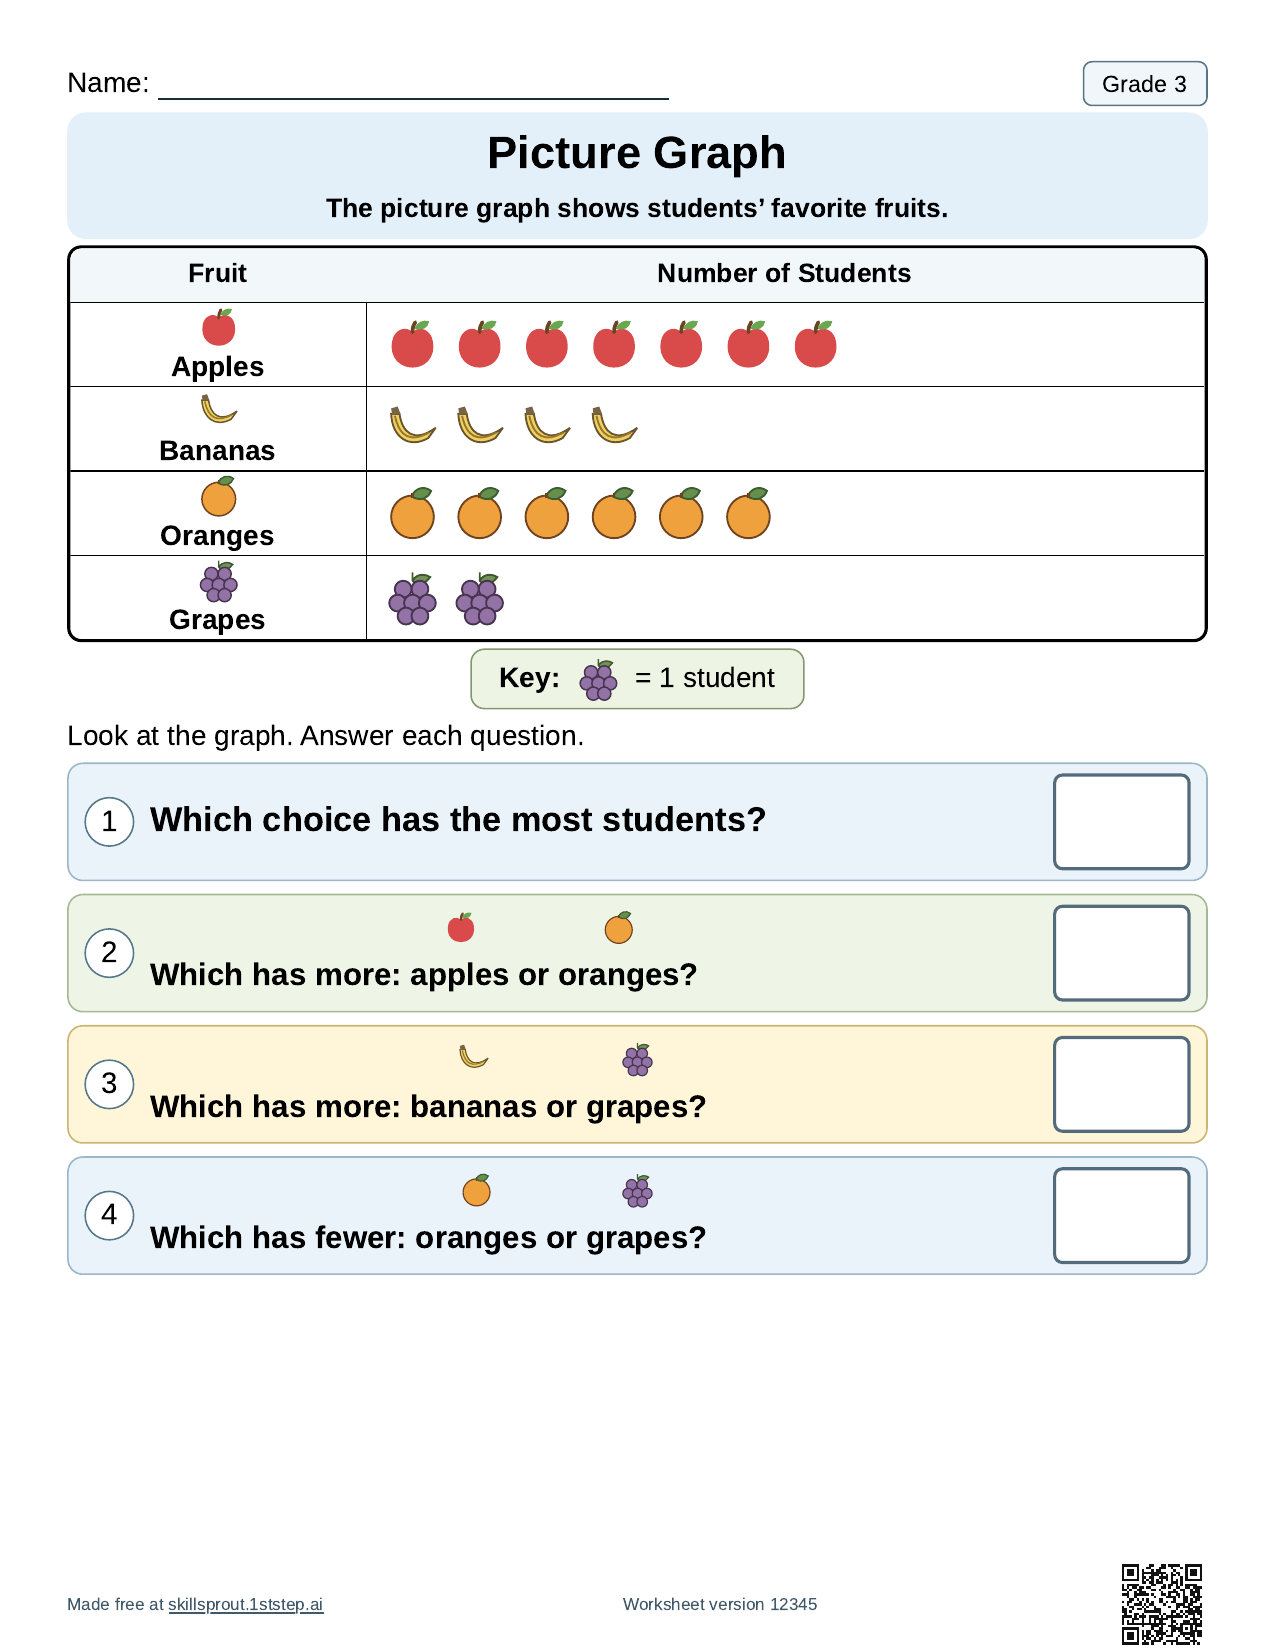
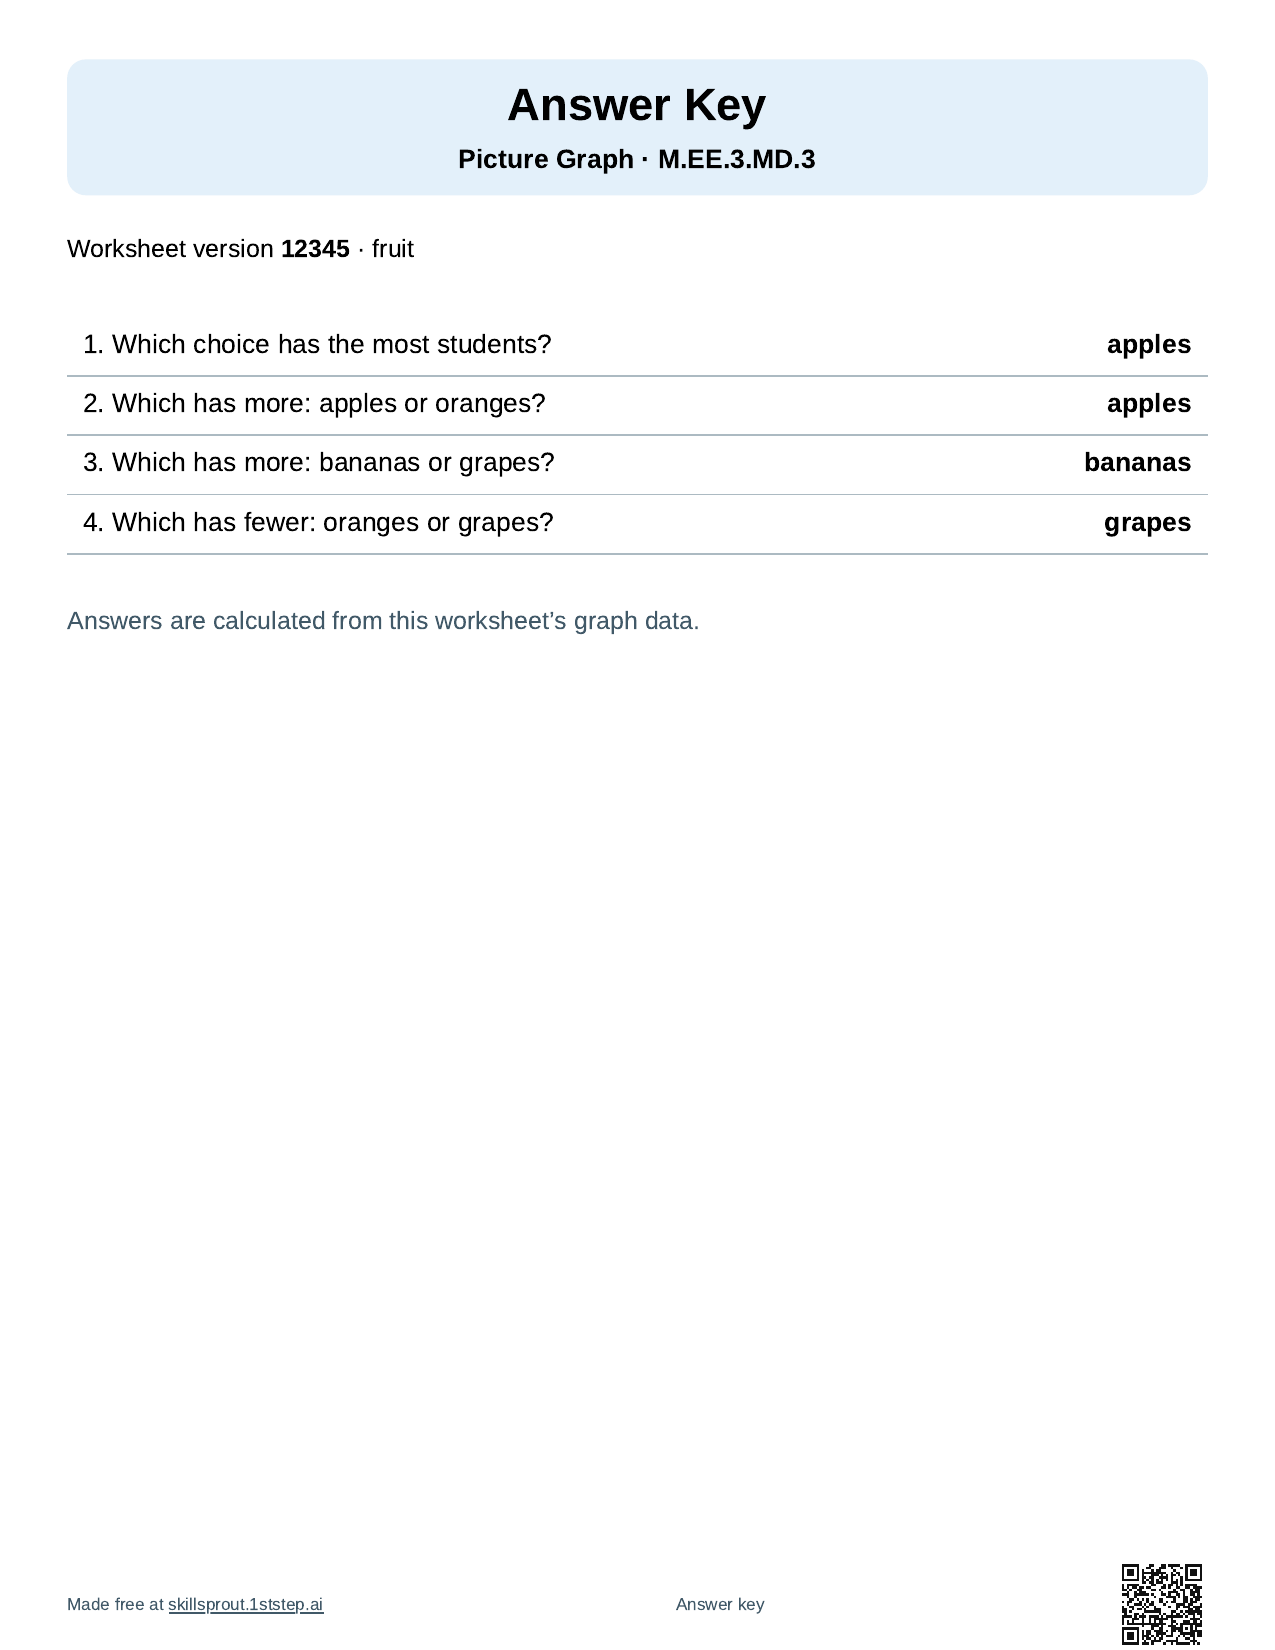
"Which choice has the most students?" is the same question as "Which fruit won the vote?", which makes it a natural place to talk about what most means.
How to make your class's sheet
- Open the Grade 3 read and compare picture or bar graphs page, or start from the picture graph worksheet maker. Both open the SkillSprout studio, which uses Google sign-in.
- Open Advanced and set Theme to Fruit. Choose Worksheet Type (Picture Graph · Read or Picture Graph · Compare) and Practice Level (Compare needs Level 2 or 3).
- Open Graph counts & question categories, check Set graph counts, and type your class's counts for apples, bananas, oranges, and grapes.
- Set Questions, the response format (fill in the blank, multiple choice, or cut and paste), visual support, and color or grayscale. Keep Include answer keys after student pages checked if you want the key.
- Press Generate Worksheets, check the preview, then print or download the PDF yourself.
To get the exact sheets above, enter the same counts and worksheet version 12345 with three questions (read) or four questions (compare).
Other options
The same builder makes bar graphs; see the bar graph worksheet maker. For Grade 4, the Grade 4 read and compare picture or bar graphs page opens the same kind of activity. Other themes include pets, toys, transportation, and weather, so a second vote can use a different set of pictures. All ready skills are on the worksheets page.
The worksheet pages are public to browse with no login. Making and printing a sheet happens in the studio with Google sign-in. Only the four vote counts go into the builder; no student names, diagnoses, or student work are needed, and the name line prints blank.